
Gallery

Overview
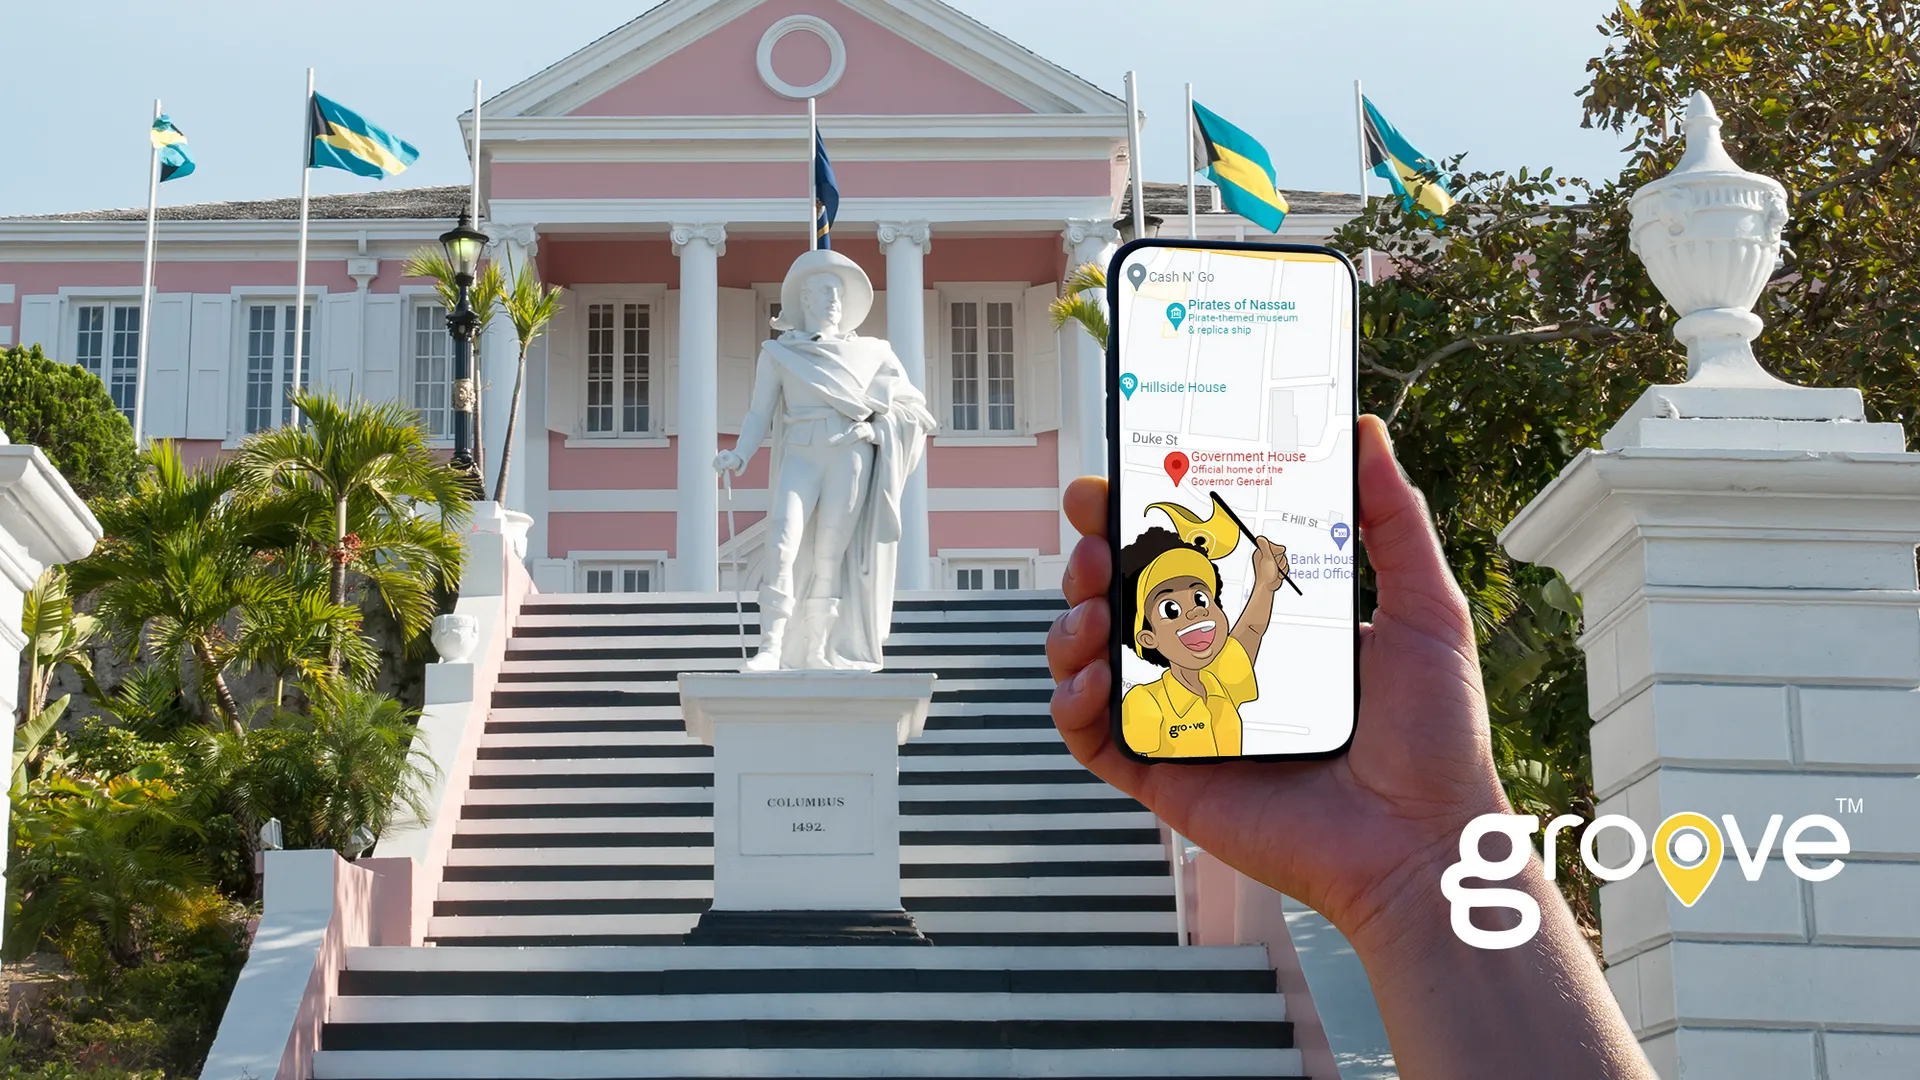
Bahama Myfi is poised to become an industry leader with its new Groove tourism marketplace platform which utilizes augmented reality (AR) to provide an immersive and customizable vacation experience.
Reasons to Invest
- Demand for high-quality tourist attractions and entertainment is projected to explode with the increase in cruise ship traffic and the recent $4.5 B investment in the Port of Bahamas.
- First-mover advantage for Bahama Myfi through its proprietary cutting-edge AR technology and marketplace for tourists and merchants.
- Advertising, commissions, tour sales, and AR app revenue will greatly enhance Groove’s growth potential and create a large and consistent revenue stream.
- Marcian Cash brings over 30 years regional expertise and connections that are key for Groove’s success.
- Multiple revenue streams, high transaction volume and scalability will drive significant ROI and growth in the retail tourist market as well as B2B.
The Opportunity
- Increasing demand for high-quality, safe and affordable entertainment and attractions for tourists is not currently being met by existing business ecosystem and infrastructure
- Limited accessibility and awareness of tourist attractions, entertainment and merchandise in the Bahamas and other regions in the Caribbean is hampering growth
- No efficient ecosystem, marketplace or platform to bring tourists and merchants together
- Opportunity for Bahama Myfi to capture a large percentage of tourist spend in 2022 through 2025
The Bahama Myfi Solution
- Bahama Myfi’s Groove lowers the cost and removes the issues, friction and obstacles that typically occur when tourists book tours or need to plan their itinerary
- More efficient use of consumers’ entertainment dollar that is earmarked for tours, merchandise, etc.
- Groove provides businesses more efficient paths to market and connects them with customers that would otherwise be unavailable
- Groove delivers a more enjoyable, time efficient, cost-effective vacation experience for tourists
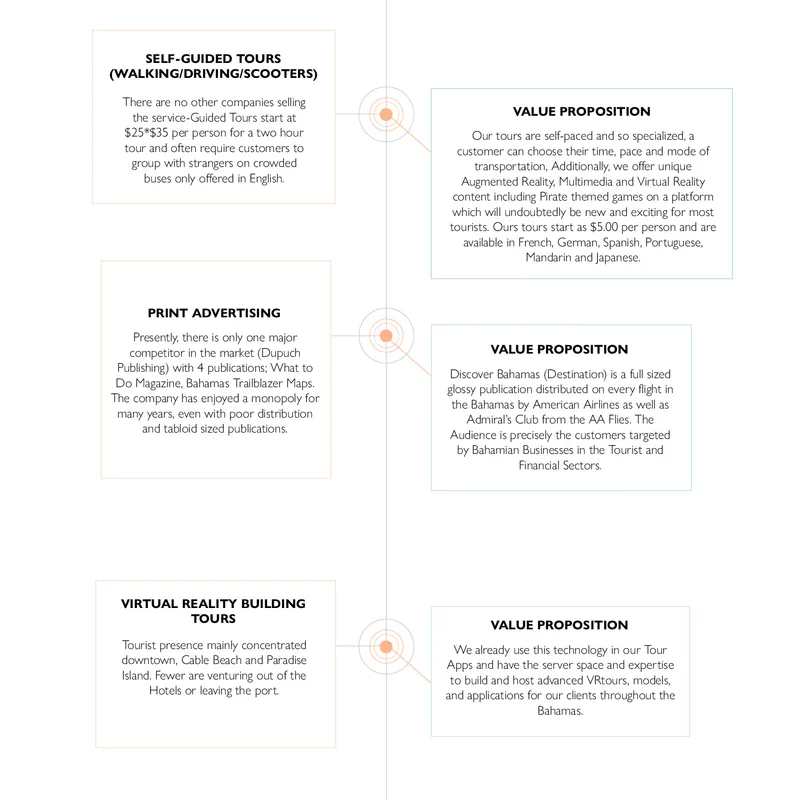
The Bahama Myfi Advantage
- Groove tours are self-paced, specialized, entertaining, low-cost, and offered in multiple languages.
- Currently no tour company in the region offers self-guided tours (only group bus tours).
- The Groove app enables personalized and customized tour experiences across wide geographic areas.
- Groove provides a no wait, walk-up service or can be ordered from the marina or hotel.
- Groove integrations with network of taxis, ferries and jitneys dramatically lower transportation costs for tourists.
- Convenient cashless transactions stored and tracked within the Groove app.
- Geo-based and real-time reactionary advertising for merchants and tourist companies maximize revenue and utilize unused service capacity.
Competition
- Cruise line and hotel tour desks and concierge services
- Traditional print and digital travel platforms (Bahama Local)
- Local taxi services which are expensive, less informative, and unaccessible,and less relevant to today’s tourism consumer
Use of Proceeds
Capital Raise
- A capital injection of $1.8M is needed to enable Bahama Myfi to hire staff, complete the ongoing redevelopment of our major applications and acquire necessary assets. Intellectual property rights will be acquired after this development iteration in 2021.
Use of Funds
|
$ |
|
|---|---|
|
1,020,000 |
Peek Burn Rate (Salaries & Wages + Expenses) x 15 Months |
|
200,000 |
External Labor |
|
$1,220,000 |
Sub Total |
|
$ |
Assets |
|---|---|
|
65,000 |
Vehicles (1 Delivery Van, 1 Personel Van, 1 Scooter) |
|
35,000 |
Office Furniture |
|
9,500 |
Warehouse Racks/ Equipment |
|
30,000 |
Computers/Printers/Switches |
|
31,000 |
Production Equipment (Camera, Sound, Lighting) |
|
8,000 |
Drones |
|
30,000 |
LTE Devices (100 @ $300) |
|
45,000 |
Salable Inventory |
|
25,000 |
POS |
|
6,000 |
Uniforms |
|
17,500 |
Staff Devices |
|
13,000 |
Signage |
|
15,000 |
Scooter Communications Kit |
|
330,000 |
Subtotal Assets |
|
250,000 |
Legal (Patent Research/Application) |
|
$1,800,000 |
Grand Total |
Business Model
Our Business Model is predicated on two major Profit Centers at the top level:
- Consumer – Products designed for tourist consumption.
- B2B -Traditional and Non-traditional advertising opportunities for companies targeting tourists.
In order to accomplish this Bahama Myfi has purposely built its products and advertising platforms incorporating the fastest growing global technologies and trends as well as self-commissioned U&A studies to ensure that our potential customers’ core needs are being met.
The results of one of our commissioned U&A Studies show that visitors are very interested in access to Wifi and local businesses are very likely to expand their digital spend in the future. Further analysis of the data allowed us to design, price and customize the Bahama Myfi offerings according to market demand. Within our major target markets, “B2B” and “B2C” are several sub-segments:
Each corresponding sub-segment is linked to a specific tourist related product used by the consumer and a platform used for advertising by B2B.In other words, Bahama Myfi advertises in Discover Bahamas which supports our end consumer sales of data services, tours, etc. and, while consuming those products, the customer is connected to our in-app digital advertising services which serves our B2B client in terms of business acquisition, but also provides the end consumer new value propositions in real time.Managing this portfolio of products would not be possible without years of product development, custom programming, and integration.
Vision
- Bahama Myfi’s founder, Marcian Cash, envisions becoming the industry standard marketplace for tourism in the Bahamas and the world.
- Its unique ability to connect Bahama businesses with tourists will result in Bahama Myfi becoming the “go to” platform for everything tourist related in the region. (Both B2C and B2B.)
- Bahama Myfi to level the playing field that allows smaller tour companies and merchants to successfully compete against large tour companies with alliances with cruise line and hotels.
Why Invest Now
- Recent changes have improved the disembarkation status of cruise ships in Nassau which will greatly increase tourist’s stay and spend.
- First-mover advantage and opportunity for BMF to lock in its position as the tourist platform leader in this space.
- $4B investment in the Nassau Cruise Port in 2023; 8 more cruise ship slips.
The Team
Marcian Cash (CEO) got his start in the Hotel business at Trust House Forte’s Nassau Beach Hotel rising to the rank of Executive Assistant Manager at Ramada International’s South Ocean Beach resort. His career includes tenure with Heineken as Marketing Manager with training in sales and marketing techniques whichhelped in business development. Marcian spent almost 15 years as Sales and Marketing Manager with Thompson Trading Company. Recently, he served as Residential Sales Manager at Cable Bahamas Vice President of Sales and Marketing at BTC.
Thomas Brown (CFO) has had extensive experience in administration of Finance related legislation and regulations, particularly those relating to Business Licensesand Bahamian Taxes. Through his 34 years he served in various Departments under the Ministry of Finance and held positions in various sectors, including: Customer Service training and supervision, Analyzing regulations for practical implementation, Help-desk training and support, and Reporting.
Dominic Nottage (CTO) has over 20 years of experience in Software Development in 5 different countries for government agencies and private businesses. His projects have utilized his skills in application development as well as project management. He has taught coding, security clearance to write code for Broward County, and was an IT member of the Broward Emergency Response Team at for five years. He is now an instructor of Microsoft’s certification course for software developers (MTS 98-361).
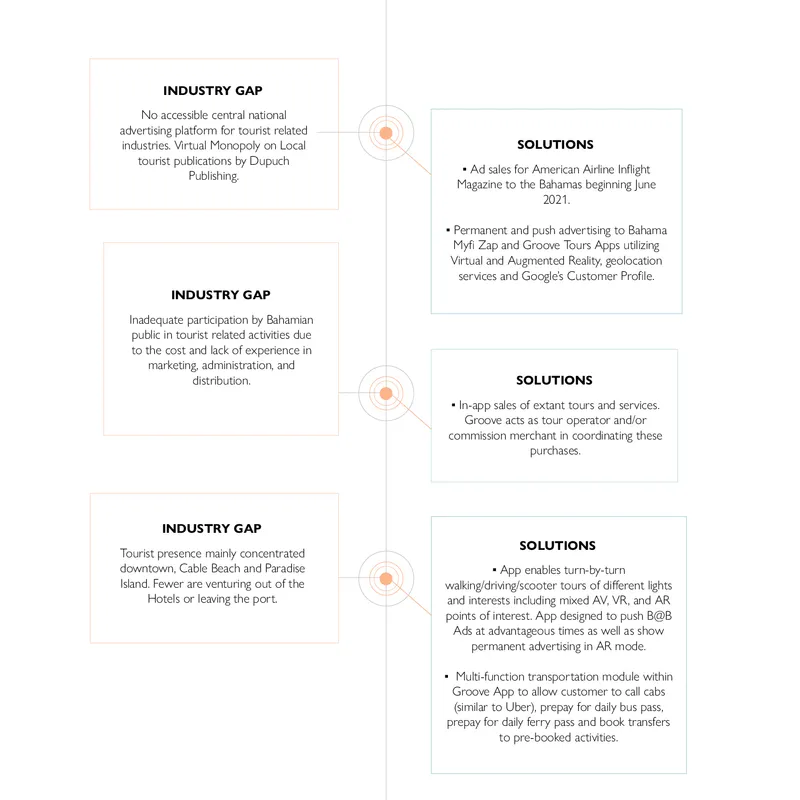
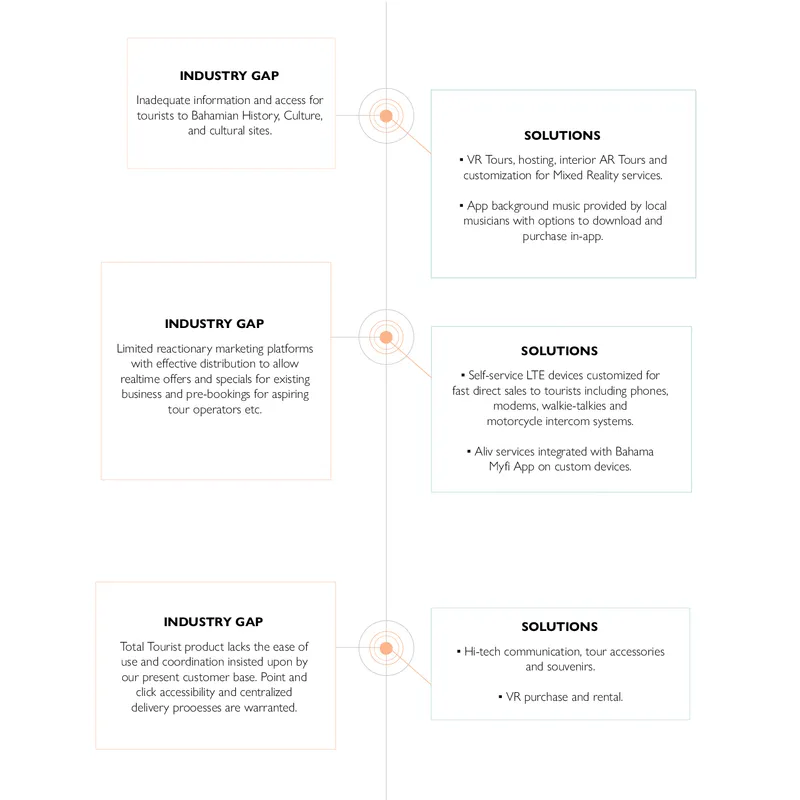
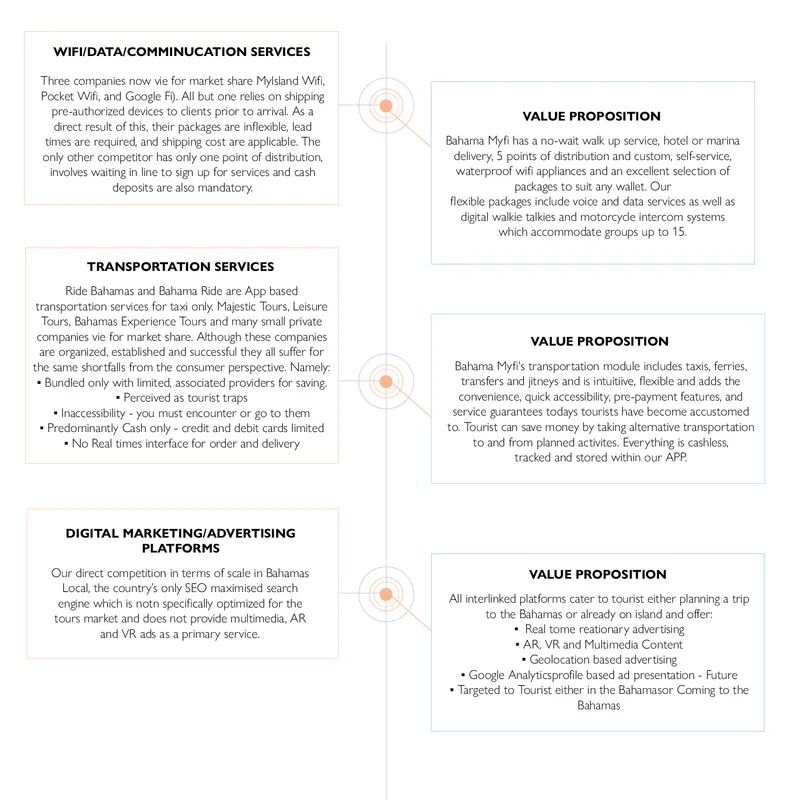
Industry Gaps & Solutions
Opportunity
Marketing & Sales
Marketing/Distribution Plan
- SEO Driven website utilizing Google, Facebook & YouTube Ads to drive traffic based on travel readiness profiles
- Google, Facebook and YouTube ads
- Explainer Videos
- Full page advertisement in AA in-flight magazine (inside cover)
- Signage at points of sale, on all participating transit vehicles and on Bahama Myfi fleet.
Sales Plan
- Fully functional integrated eCommerce site for web orders for Bahama Myfi and Groove products
- 5 person strong, trained and computerized Ad sales Team with Manager.
- Warm/Cold Calls
- Telesales using progressive dialer and leads by webform
- Email campaigns
- Social media campaigns
- Sales presence on Major Tour Operator fleet of 22 buses conducting transfers from the airport to hotels, marinas and guest houses
- Five walk up locations located in high traffic tourist areas downtown Nassau and Paradise Island
- Each of 26 Sales Representatives are a WIFI Hotspot (each salesperson is equipped with a portable broadband Wi-Fidevice.
- Our offer is “Receive 30 Mins of Free Wi-Fiand a free walking tour for just downloading our Groove APP
- During explanation of how to use the tour we also introduce customer to all of our other services and accessories.
- Commission on any service booked by the APP is paid to the initial salesperson for the duration of their stay. Salespersons may send push messages to all or specific customers through the APP.
Operations
Locations & Facilities
Our Corporate, Sales, Marketing and Production offices are located at #1 Bay Street and, as a part of theIncudesk franchise, we can scale our operation with demand and take advantage of their structured network and shared facilities without incurring the extra associated costs.We will have five kiosks in heavily trafficked tourist areas including:
1. Arawak Cay
2. Junkoo Beach
3. Prince George Warf
4. Festival Place
5. Paradise Island Ferry TerminalThese locations will serve as points of sales and distribution for our tourist related products.
Our main warehouse, located at 22 Nassau Street, will serve as our logistics hub. Pre-orders will be packed and delivered from this location and it will serve as the replenishment service for our agents downtown, at the airport and on Paradise Island.
Technology and Tools
Technology
Bahama Myfi’s technology is one if its key strategic advantages. In fact, 70% of the company’s startup capital has been invested in our technology. We have undertaken several demos, false starts,UAT’s and iterative customization before arriving at our final platform. The result is a multi-functional, robust, fully integrated workspace which requires a reduced amount of manpower to administer, operate and manage with outstanding audit and analytical capabilities. The Company is built around our technology, giving us the flexibility to adjust with demand, pay attractive commissions and compensation as well as scale and grow with the market.
We employ SAAS where possible and rely on extant managed networks, upgrading bandwidth and functionality without the expenseof buying hardwareand the maintenance costs, including salaries, typically associated with running advanced networks.
Zoho, with an advanced customer portal is our major application. We utilize the following modules:
- CRM – Customer Relationship Manager
- Mail – Hosted Email and Calendar
- Campaigns – Email and Social Media Campaign Management
- Desk – Customer Help Desk
- Social – Social Media Analysis/Reporting
- Expense – Expense Report Remittance
- Meeting – Remote meeting and Management
- Motivator – Gamification for Employees and Productivity Feedback
- Projects – Project Management
- Assist – Screen Sharing Remote Assistance
- People – Human Resources Management/Evaluation/Recruitment
- Creator – Custom Interface Design/Implementation/Self Service Portals Consumer and B2B
Our two consumer APPs, Bahama Myfi ZAP and Groove Tours are integrated with our major application’s payment and inventory gateway and offers real time reporting as well as secure audit trails for our Company. Both Apps are versioned for IOS and Android.The Groove APP is Unity based and Utilizes API’s from Mapbox, AR Kit, Google Firebase, Vuforia and more.The unity platform allows us to utilize the cutting edge in AR, VR, geolocation with the flexibility to integrate our B2B advertising assets into the customers mixed reality experience.We have chosen Matterport as our Virtual Space Tour provider and hosting solution. Within the next few months,we will be integrating this service into our portfolio and workspaces to deliver one of a kind virtual tour services B2B advertising, real estate and hotels.

Tools
Because our advertising platforms are technologically based and media rich our company uses stateof the art tools not typically associated with the tourism sector. A brief list follows:
- 360degreeCameras
- 3D Cameras
- Digital Cameras and Cinematographic Quality lenses
- Quad-copter Drones
- AV mixers
- Omni-directional, Boom and condensing microphones
- Graphic design capable computers and storage systems.
- Custom LTE Devices
- Custom Motorcycle Intercom Systems
Key Metrics
Our primary measurement of success for our consumer products is penetration % based on the total New Providence tourist market by segment. We haveused 2019 date to extrapolate the next fiscal year. Note that our forecast penetration for the first year is exceptionally lowand should be easily attainable. Our free tours are the business drivers.
B2B Services Our B2B forecast is based on direct targeting of a group of New Providence and selected Family Island tourism dependent businesses represented by the following verticals(N=4325):
- Hotels
- Restaurants
- Tour Operators
- Tourist Retail
- Marinas
- Livery Services and Transportation
- Real Estate Companies
- Wealth Management Companies
- Legal and Professional Services
- Charter Services Air/SeaOur B2B Sales Campaigns, utilizing direct meetings, email, social media and Telephone contact strategies coordinated by our CRM, depends on an overall close rate of 10%
Key Assumptions
- Bahamian tourist business will resume operations by the second quarter 2021 and business will continue to improve through Q4
- There will be no unforeseen impediments to our planned sales and operations strategy due to the Covid 19 pandemic
- We will attain our penetration objectives as laid out in Target Market
- There will not be a significant change in the VAT rate or impot duties
Ownership Structure & Rights of Securities
FY2022-FY2024 Forecast
Revenue
|
Revenue |
Type |
FY2022 |
FY2023 |
FY2024 |
|---|---|---|---|---|
|
Discover Bahamas Magazine Groove In-App Advertising Groove Walking Tours Groove Driving Tours Groove Merchandise Sales Groove 3rd Party Tours Groove Local Music Bahama My LTE Rentals Bahama My Data Sales Bahama My Hey Taxi Bahama My Transfers Bahama My Bus Pass Bahama My Ferry Pass Bahama My Merchandise Sales Bahama My Virtual Tours Services |
Advertising Advertising Augmented Reality Tours Augmented Reality Tours Merchandise Other Other Data & Communications Data & Communications Transportation Transportation Transportation Transportation Merchandise Other |
$288,840 $67,800 $175,000 $64,000 $49,679 $162,500 $37,260 $144,000 $194,507 $207,600 $135,000 $174,000 $114,000 $58,073 $115,899 |
$1,022,975 $253,095 $492,000 $132,000 $74,000 $351,000 $81,000 $273,000 $329,590 $562,500 $225,000 $330,000 $240,000 $184,000 $183,967 |
$1,203,500 $439,000 $612,000 $174,000 $100,000 $507,000 $104,400 $340,600 $408,405 $787,500 $288,000 $450,000 $360,000 $304,500 $262,810 |
|
Total |
$1,988,158 |
$4,734,127 |
$6,341,715 |
|
Brand |
FY2022 |
FY2023 |
FY2024 |
% |
|---|---|---|---|---|
|
Discover Magazine Groove Ads Augmented Reality Tours Merchandise 3rd Party Tours Music Downloads LTE Rentals LTE Data Hey Taxi Transfers Bus Pass Ferry Pass Virtual Bahamas |
288840 67800 239000 107752 162500 37260 144000 194507 207600 13500 174000 114000 115899 |
1022975 253095 624000 258000 351000 81000 273000 329590 562500 225000 330000 240000 183967 |
1203500 439000 786000 404500 507000 104400 340600 408405 787500 288000 450000 360000 262810 |
19% 7% 12% 6% 8% 2% 5% 6% 12% 5% 7% 6% 4% |
|
Total |
1988158 |
4734127 |
6341715 |
100% |
|
Category |
FY2022 |
FY2023 |
FY2024 |
% |
|---|---|---|---|---|
|
Advertising Augmented Reality Tours Merchandise Other Data & Communications Transportation |
$356,640 $239,000 $107,752 $315,659 $338,507 $630,600 |
$1,276,070 $624,000 $258,000 $615,967 $602,590 $1,357,500 |
$1,642,500 $786,000 $404,500 $874,210 $749,005 $1,885,500 |
26% 12% 6% 14% 12% 30% |
|
Total |
$1,988,158 |
$4,734,127 |
$6,341,715 |
100% |
Direct Costs
|
Direct Costs |
Brand |
Type |
FY2022 |
FY2023 |
FY2024 |
|---|---|---|---|---|---|
|
SC - Discover Magazine SC - Groove In-App Advertising SC - Groove Walking Tours SC - Groove Driving Tours SC - Groove Merchandise Sales SC - Groove 3rd Party Tours SC - Groove Local Music SC - Bahama My LTE Rentals SC - Bahama My Data Sales SC - Bahama My Virtual Tour Services SC - Bahama My Hey Taxi SC - Bahama My Transfers SC - Bahama My Bus Pass SC - Bahama My Ferry Pass SC - Bahama My Merchandise Sales Bahama My Exec Commission |
Discover Magazine Groove Ads Augmented Reality Tours Augmented Reality Tours Merchandise 3rd Party Tours Music Downloads LTE Rental LTE Data Virtual Bahamas Hey Taxi Transfers Bus Pass Ferry Pass Merchandise Other |
Advertising Advertising Augmented Reality Tours Augmented Reality Tours Merchandise Other Other Data & Communications Data & Communications Other Transportation Transportation Transportation Transportation Merchandise Other |
$34,661 $8,136 $17,500 $6,400 $4,968 $8,125 $1,863 $14,400 $19,451 $13,908 $10,380 $6,750 $8,700 $5,700 $2,904 $79,526 |
$122,757 $30,371 $49,200 $13,200 $7,400 $17,550 $4,050 $27,300 $32,959 $22,076 $28,125 $11,250 $16,500 $12,000 $9,200 $189,365 |
$144,420 $52,680 $61,200 $17,400 $10,000 $25,350 $5,220 $34,060 $40,840 $31,537 $39,375 $14,400 $22,500 $18,000 $15,225 $253,669 |
|
Total |
$1,356,644 |
$3,272,452 |
$4,339,915 |
*SC = Sales Commission
*MF = Management Fees
|
Brand |
FY2022 |
FY2023 |
FY2024 |
|---|---|---|---|
|
Discover Magazine Groove Ads Augmented Reality Tours Merchandise 3rd Party Tours 4th Paty Tours Music Downloads LTE Rentals LTE Data Virtual Bahamas Hey Taxi Transfers Bus Pass Ferry Pass Other |
254179 14916 47800 50134 8125 138125 29808 14400 124485 13908 193068 125550 156600 106020 79526 |
900218 55681 124800 108800 17550 298350 64800 27300 210937 22076 523125 209250 297000 223200 189365 |
1059080 96580 157200 166575 25350 430950 83520 34060 261379 31537 732375 267840 405000 334800 253669 |
|
Total |
1356644 |
3272452 |
4339915 |
|
Category |
FY2022 |
FY2023 |
FY2024 |
|---|---|---|---|
|
Advertising Augmented Reality Tours Merchandise Other Data & Communications Transportation |
$269,095 $47,800 $50,134 $269,492 $138,885 $581,238 |
$955,899 $124,800 $108,800 $592,141 $238,237 $1,252,575 |
$1,155,660 $157,200 $166,575 $825,026 $295,439 $1,740,015 |
|
Total |
$1,356,644 |
$3,272,452 |
$4,339,915 |
Gross Profit
|
Revenue Catergory |
FY2022 |
FY2023 |
FY2024 |
% |
|---|---|---|---|---|
|
Advertising Augmented Reality Tours Merchandise Other Data & Communications Transportation |
$356,640 $239,000 $107,752 $315,659 $338,507 $630,600 |
$1,276,070 $624,000 $258,000 $615,967 $602,590 $1,357,500 |
$1,642,500 $786,000 $404,500 $874,210 $749,005 $1,885,500 |
26% 12% 6% 14% 12% 30% |
|
Total |
$1,988,158 |
$4,734,127 |
$6,341,715 |
100% |
|
Cost of Sales Catergory |
FY2022 |
FY2023 |
FY2024 |
% |
|---|---|---|---|---|
|
Advertising Augmented Reality Tours Merchandise Other Data & Communications Transportation |
$269,095 $47,800 $50,134 $269,492 $138,885 $581,238 |
$955,899 $124,800 $108,800 $592,141 $238,237 $1,252,575 |
$1,155,660 $157,200 $166,575 $825,026 $295,439 $1,740,015 |
70% 20% 41% 94% 39% 92% |
|
Total |
$1,356,644 |
$3,272,452 |
$4,339,915 |
68% |
|
Gross Profit Catergory |
FY2022 |
FY2023 |
FY2024 |
% Rev Cat |
% Total |
|---|---|---|---|---|---|
|
Advertising Augmented Reality Tours Merchandise Other Data & Communications Transportation |
$87,545 $191,200 $57,618 $46,167 $199,622 $49,362 |
$320,171 $499,200 $149,200 $23,826 $364,353 $104,925 |
$486,840 $628,800 $237,925 $49,184 $453,566 $145,485 |
30% 80% 59% 6% 61% 8% |
24% 31% 12% 2% 23% 7% |
|
Total |
$631,514 |
$1,461,675 |
$2,001,800 |
32% |
100% |
*Advertising, Augmented Reality Tours and Data & Communications is 78% of the Gross Profit
Expenses
|
Expenses |
FY2022 |
FY2023 |
FY2024 |
|---|---|---|---|
|
Rent |
$35,100 |
$47,000 |
$58,000 |
|
Total |
$145,104 |
$256,753 |
$333,143 |
Salaries
|
Personnel |
FY2022 |
FY2023 |
FY2024 |
|---|---|---|---|
|
Head Count Salaries and Wages Employee-Related Expenses |
11.84
$36,828 |
26
$71,940 |
32
$85,536 |
|
Total |
$417,828 |
$844,740 |
$1,021,536 |
P&L
|
Gross Profit Category |
FY2022 |
FY2023 |
FY2024 |
% Rec Cat |
% Total |
|---|---|---|---|---|---|
|
Advertising |
$87,545 |
$320,171 |
$486,840 |
30% |
24% |
|
Total |
$631,514 |
$1,461,675 |
$2,001,800 |
32% |
100% |
*Advertising, Augmented Reality Tours and Data & Communications is 78% of the Gross Profit
|
Expenses |
FY2022 |
FY2023 |
FY2024 |
% Total |
|---|---|---|---|---|
|
Rent |
$35,100 |
$47,000 |
$58,000 |
3% |
|
Total |
$145,104 |
$256,753 |
$333,143 |
17% |
|
Amortization of Other Current Assets |
$11,667 |
$2,333 |
$0 |
|
|---|---|---|---|---|
|
Personnel |
FY2022 |
FY2023 |
FY2024 |
|
|
Head Count Salaries and Wages |
11.84
$36,828 |
26
$71,940 |
32
$85,536 |
21% 4% |
|
Total |
$417,828 |
$844,740 |
$1,021,536 |
51% |
|
Operating Income |
$68,582 |
$360,182 |
$647,121 |
|
|---|---|---|---|---|
|
Interest/Depreciation |
FY2022 |
FY2023 |
FY2024 |
|
|
Interest Expense |
$7,869 $0 $15,000 |
$9,228 $0 $18,067 |
$8,365 $0 $18,066 |
0% 0% 1% |
|
Total |
$22,896 |
$27,295 |
$26,431 |
1% |
|
NET P/L |
$45,686 |
$332,887 |
$620,690 |
|
|
2% |
7% |
10% |
||
Risks & Disclosures
THE OFFERING MATERIALS MAY CONTAIN FORWARD-LOOKING STATEMENTS AND INFORMATION RELATING TO, AMONG OTHER THINGS, THE COMPANY, ITS BUSINESS PLAN AND STRATEGY, AND ITS INDUSTRY. THESE FORWARD-LOOKING STATEMENTS ARE BASED ON THE BELIEFS OF, ASSUMPTIONS MADE BY, AND INFORMATION CURRENTLY AVAILABLE TO THE COMPANY’S MANAGEMENT. WHEN USED IN THE OFFERING MATERIALS, THE WORDS “ESTIMATE,” “PROJECT,” “BELIEVE,” “ANTICIPATE,” “INTEND,” “EXPECT” AND SIMILAR EXPRESSIONS ARE INTENDED TO IDENTIFY FORWARD-LOOKING STATEMENTS, WHICH CONSTITUTE FORWARD LOOKING STATEMENTS. THESE STATEMENTS REFLECT MANAGEMENT’S CURRENT VIEWS WITH RESPECT TO FUTURE EVENTS AND ARE SUBJECT TO RISKS AND UNCERTAINTIES THAT COULD CAUSE THE COMPANY’S ACTUAL RESULTS TO DIFFER MATERIALLY FROM THOSE CONTAINED IN THE FORWARD-LOOKING STATEMENTS. INVESTORS ARE CAUTIONED NOT TO PLACE UNDUE RELIANCE ON THESE FORWARD-LOOKING STATEMENTS, WHICH SPEAK ONLY AS OF THE DATE ON WHICH THEY ARE MADE. THE COMPANY DOES NOT UNDERTAKE ANY OBLIGATION TO REVISE OR UPDATE THESE FORWARD-LOOKING STATEMENTS TO REFLECT EVENTS OR CIRCUMSTANCES AFTER SUCH DATE OR TO REFLECT THE OCCURRENCE OF UNANTICIPATED EVENTS.
WHILE THE COMPANY HAS SIGNED A QUOTATION AGREEMENT TO TRADE THE SECURITIES OFFERED ON ARAWAKX SECONDARY’S NEW ALTERNATIVE TRADING SYSTEM (THE “ATS”), A COMPANY WHICH INTENDS TO BE QUOTED ON THE MARKETPLACE WILL BE SUBJECT TO CERTAIN REQUIREMENTS WHICH THE COMPANY MAY OR MAY NOT BE ABLE TO SATISFY IN A TIMELY MANNER. EVEN IF A COMPANY IS QUALIFIED TO QUOTE ITS SECURITIES ON THE MARKET, THERE IS NO GUARANTEE AN ACTIVE TRADING MARKET FOR THE SECURITIES WILL EVER DEVELOP, OR IF DEVELOPED, BE MAINTAINED. YOU SHOULD ASSUME THAT YOU MAY NOT BE ABLE TO LIQUIDATE YOUR INVESTMENT FOR SOME TIME OR BE ABLE TO PLEDGE THESE SHARES AS COLLATERAL.
View our Offering Documents
You must register or log in before you can view this page.
MEET THE BAHAMA MYFI LTD. | GROOVE TEAM

Comments
You must log in to comment.